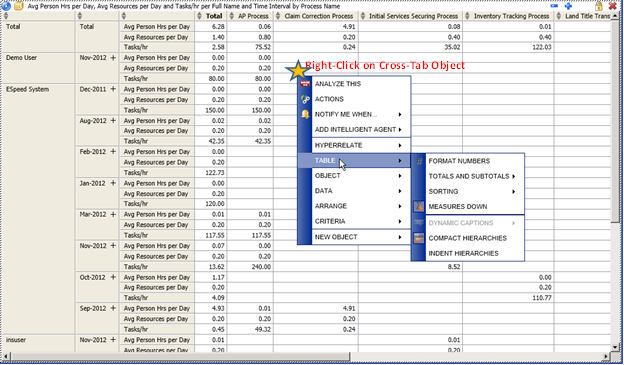
Format table functions can be accessed by right-clicking the object, and selecting 'Format table' from the right-click menu, shown below.
|
Format Table Function Element |
Format Table Function Element Description |
|
Sorting & Ordering Right-Click Menu:
|
The sequence of rows in Table Objects, Cross tabulation Objects or Graphical Objects data page may be changed by right-clicking a column header and clicking `sort´. There are three basic collating sequences: § Source data order, § Ascending order, and § Descending order. An arrow up indicator in the column header means that the column is sorted ascending, an arrow down indicator means the column is sorted descending, and both indicators mean that the Source data order is in effect. Consecutive left-clicks in the column header arrows will toggle between the three basic collating sequences. Note: Calculations may depend on the sorting order.
|
|
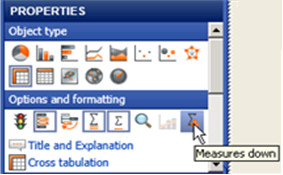
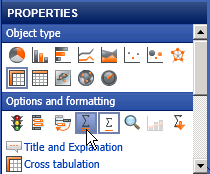
Measures Down
Smartpad: Properties tab |
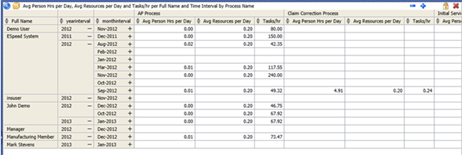
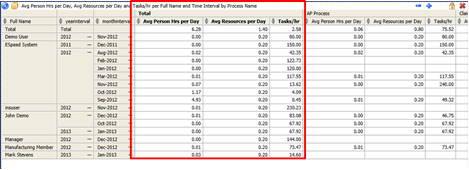
The 'Measures down' function offers the possibility of changing the way Dimensions and Measures are presented in non-graphical Objects and in the Data view of Graphical Objects. The most noticeable effect of using the 'Measures down' function is obtained when an Object consists of many Measures and one or more Dimensions with relatively few values.
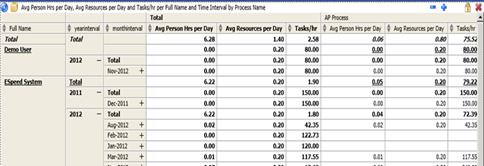
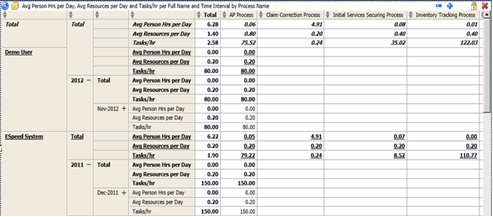
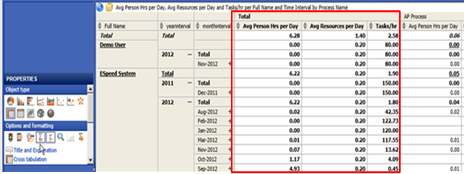
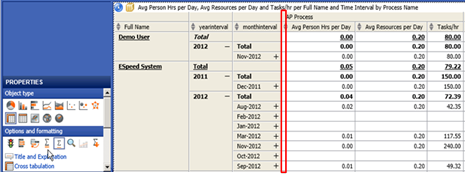
The following pair of cross-tabs illustrate the before and after effect of clicking the measures down option.
By having Measures listed vertically instead of horizontally, eliminates having to scroll the Object to see all Measures for a given Dimension value.
|
|
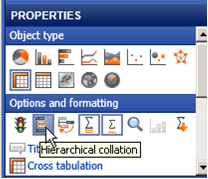
Hierarchical Collation
Smartpad: Properties tab
|
If a Table Object, Cross tabulation Object or a graphical Objects data page containing a hierarchical dimension has been sorted, this option becomes available and it is set by default.
§ This means that the rows will be sorted, but the original hierarchy will be maintained. § If this option is turned off, the hierarchy will be broken, and the order of rows will be decided by the values in the sorted column alone. Note: Turning off hierarchical collation will hide totals and subtotals. For more information see the topic: Hierarchies.
|
|
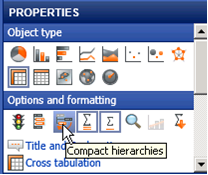
Compact Hierarchies
Smartpad: Properties tab Right-click menu:
|
By default, tables with hierarchical (multi-level) dimensions display the dimension hierarchy with one column for each level of dimension values. This option operates as a toggle that applies and removes compaction of hierarchies.
The 'Compact hierarchies' option will cause all levels of a hierarchical dimension to be displayed in a single column using indention to differentiate each of the dimension levels.
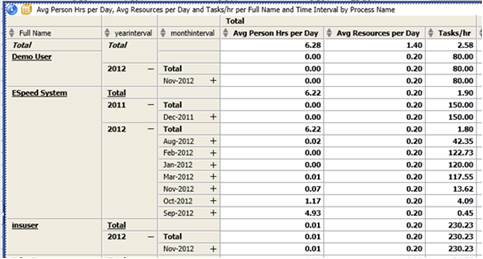
An example of a ‘Compacted Hierarchies’ operation on a Cross Tab is shown below.
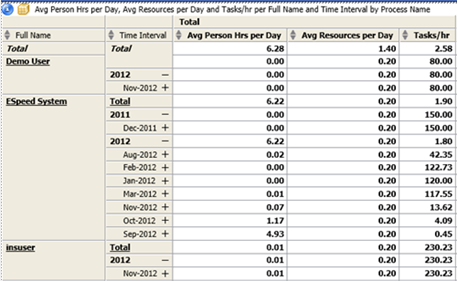
§ First Click – Applies the ‘Compact hierarchies’ option resulting in the dimensions being compacted as shown in the example below.
§ Second Click – Toggles to reverse the compaction returning the cross-tab to its previous un-compacted state, as shown previously This option may also be set in the User Preferences menu -- in this case the ‘Compact hierarchies’ feature will be applied to all new objects.
|
|
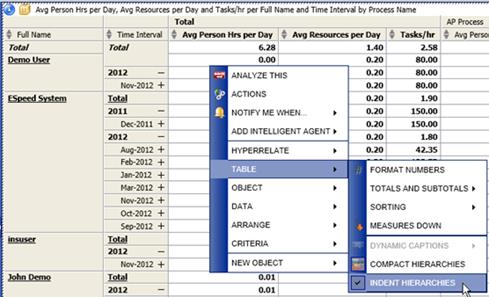
Indent Hierarchies Right-click menu: |
The 'Compact hierarchies' option will cause all levels of a hierarchical dimension to be displayed in a single column using indention to differentiate each of the dimension levels. This in-column indention feature may be toggled On and Off by using this function when the ‘Compact Hierarchies’ option is activated by doing a Right-Click on the Analytics object, shown below
|
|
Grand Totals
Smartpad: Properties tab
|
This option toggles whether the grand totals are shown or not.
This option only affects cross tabulation objects or graphical objects when they are viewed in data mode.
§ Show Grand Totals –
ON: The icon is boxed when On (
§ Show Grand Totals –
OFF: The icon is not boxed when Off (
|
|
Subtotals
Smartpad: Properties tab |
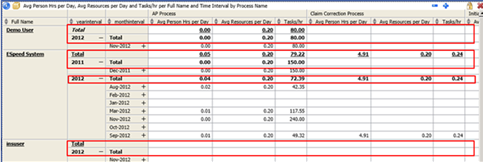
This option toggles whether the subtotals are shown or not. This option only affects cross tabulation objects or graphical objects when they are viewed in data mode. § Show Subtotals – ON:
The icon is boxed when On (
Note: The Subtotal rows (shown above, highlighted in Red-boxes) are removed from the cross-tab when the ‘Show Subtotals’ option is turned Off, as shown below.
§ Show Subtotals – OFF:
The icon is not boxed when Off (
Note: The Subtotal rows appear removed from the cross-tab when the ‘Show Subtotals’ option is Off, as shown above.
|
|
Remove Custom Order Right-click menu: |
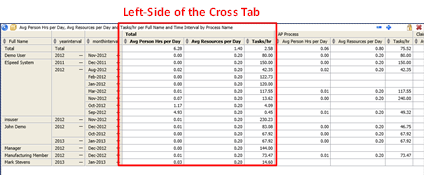
Columns and rows in Cross tabulation Objects or graphical Objects when in data mode may be rearranged by dragging individual elements to the desired position. This option removes all such custom ordering and reset the Object to its original default ordering. Note: Custom ordering of columns and rows is not available, if there is more than one dimension on the X- or Y-axis respectively.
|
|
Ignore Custom Order Right-click menu: |
Columns and rows in Cross tabulation Objects or graphical Objects when in data mode may be rearranged by dragging individual elements to the desired position. This option toggles between the current custom ordering and default original order. Note: Custom ordering of columns and rows is not available, if there is more than one dimension on the X- or Y-axis respectively.
|
|
Row Totals After Members Right-click menu: |
This option toggles whether totals and subtotals should be shown before or after the members. This option only affects Cross tabulation Objects or graphical Objects when they are viewed in data mode.
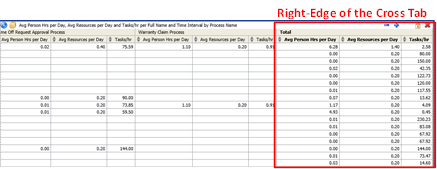
§ First Click – Activates it and moves the Row Totals that are displayed in columns to the right-end of the cross-tab.
§ Second Click – Reverses the action as a toggle, moving the Row Totals that are displayed in columns to the left-end of the cross-tab to the right of the dimensions.
Note: This option is not available, if there is more than one dimension on the X-axis.
|
|
Column Totals After Members Right-click menu: |
This option toggles whether totals and subtotals should be shown above or below the elements. Its behavior is similar to the ‘Row Totals After Members’ option, except that row-totals are shifted between top and bottom of the cross tab. This option only affects cross tabulation objects or graphical objects when they are viewed in data mode. Note: This option is not available, if there is more than one dimension on the Y-axis.
|
|
Multidimensional Subtotal Columns Right-click menu: |
This option toggles whether subtotals columns should be shown for secondary dimensions on the X-axis. This only affects cross tabulation objects or graphical objects when they are viewed in data mode. Note: This option is only relevant, if there is more than one dimension on the X-axis.
|
|
Multidimensional Subtotal Rows Right-click menu:
|
This option toggles whether subtotal rows should be shown for secondary dimensions on the Y-axis. This only affects cross tabulation objects or graphical objects when they are viewed in data mode. Note: This option is only relevant, if there is more than one dimension on the Y-axis.
|


 )
)
 )
)

 )
)
 )
)